
Spindump data is very useful when debugging sluggishness in Texifier. The spindump tool samples Texifier as you use it, recording where in the code the time is spent.
On macOS, you can use the Activity Monitor app to record this data. To begin with, launch Texifier and take it to the state in which you’re experiencing performance problems. For instance, if you’re finding the editing process to be laggy, open a representative document in Texifier.
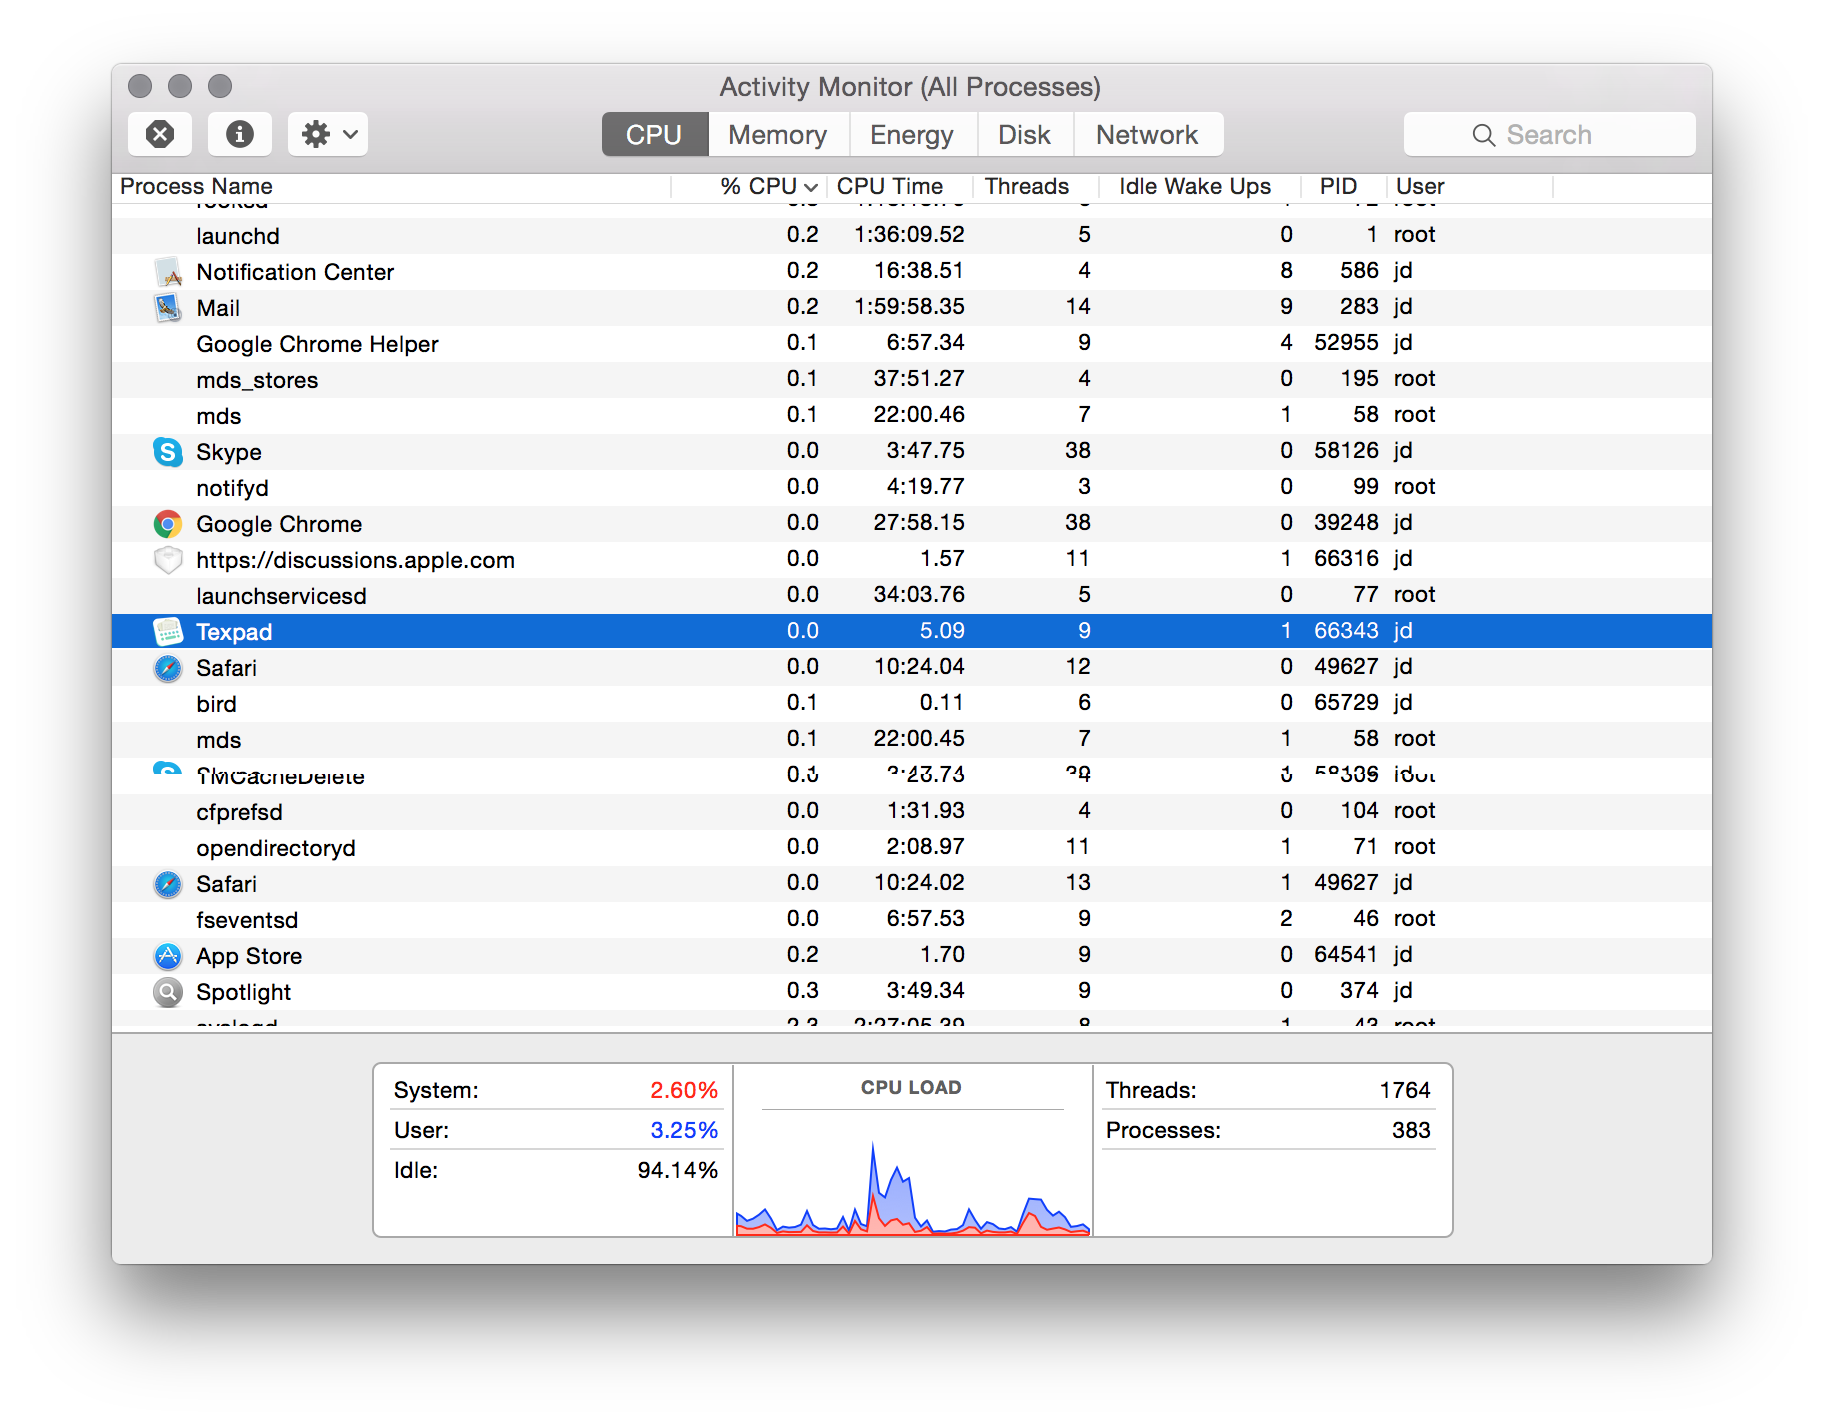
Then open Activity Monitor (that usually resides in /Applications/Utilities) and select Texifier from the list of currently running apps and processes.
Then select Run Spindump from the View menu in Activity Monitor. Follow this by heading back to Texifier to carry out the usual tasks of editing and typesetting for about half a minute. This will allow Spindump to take a sample of Texifier’s internal runtime data. Go back to Activity Monitor, the Spindump data will have been collected by now. Save this data
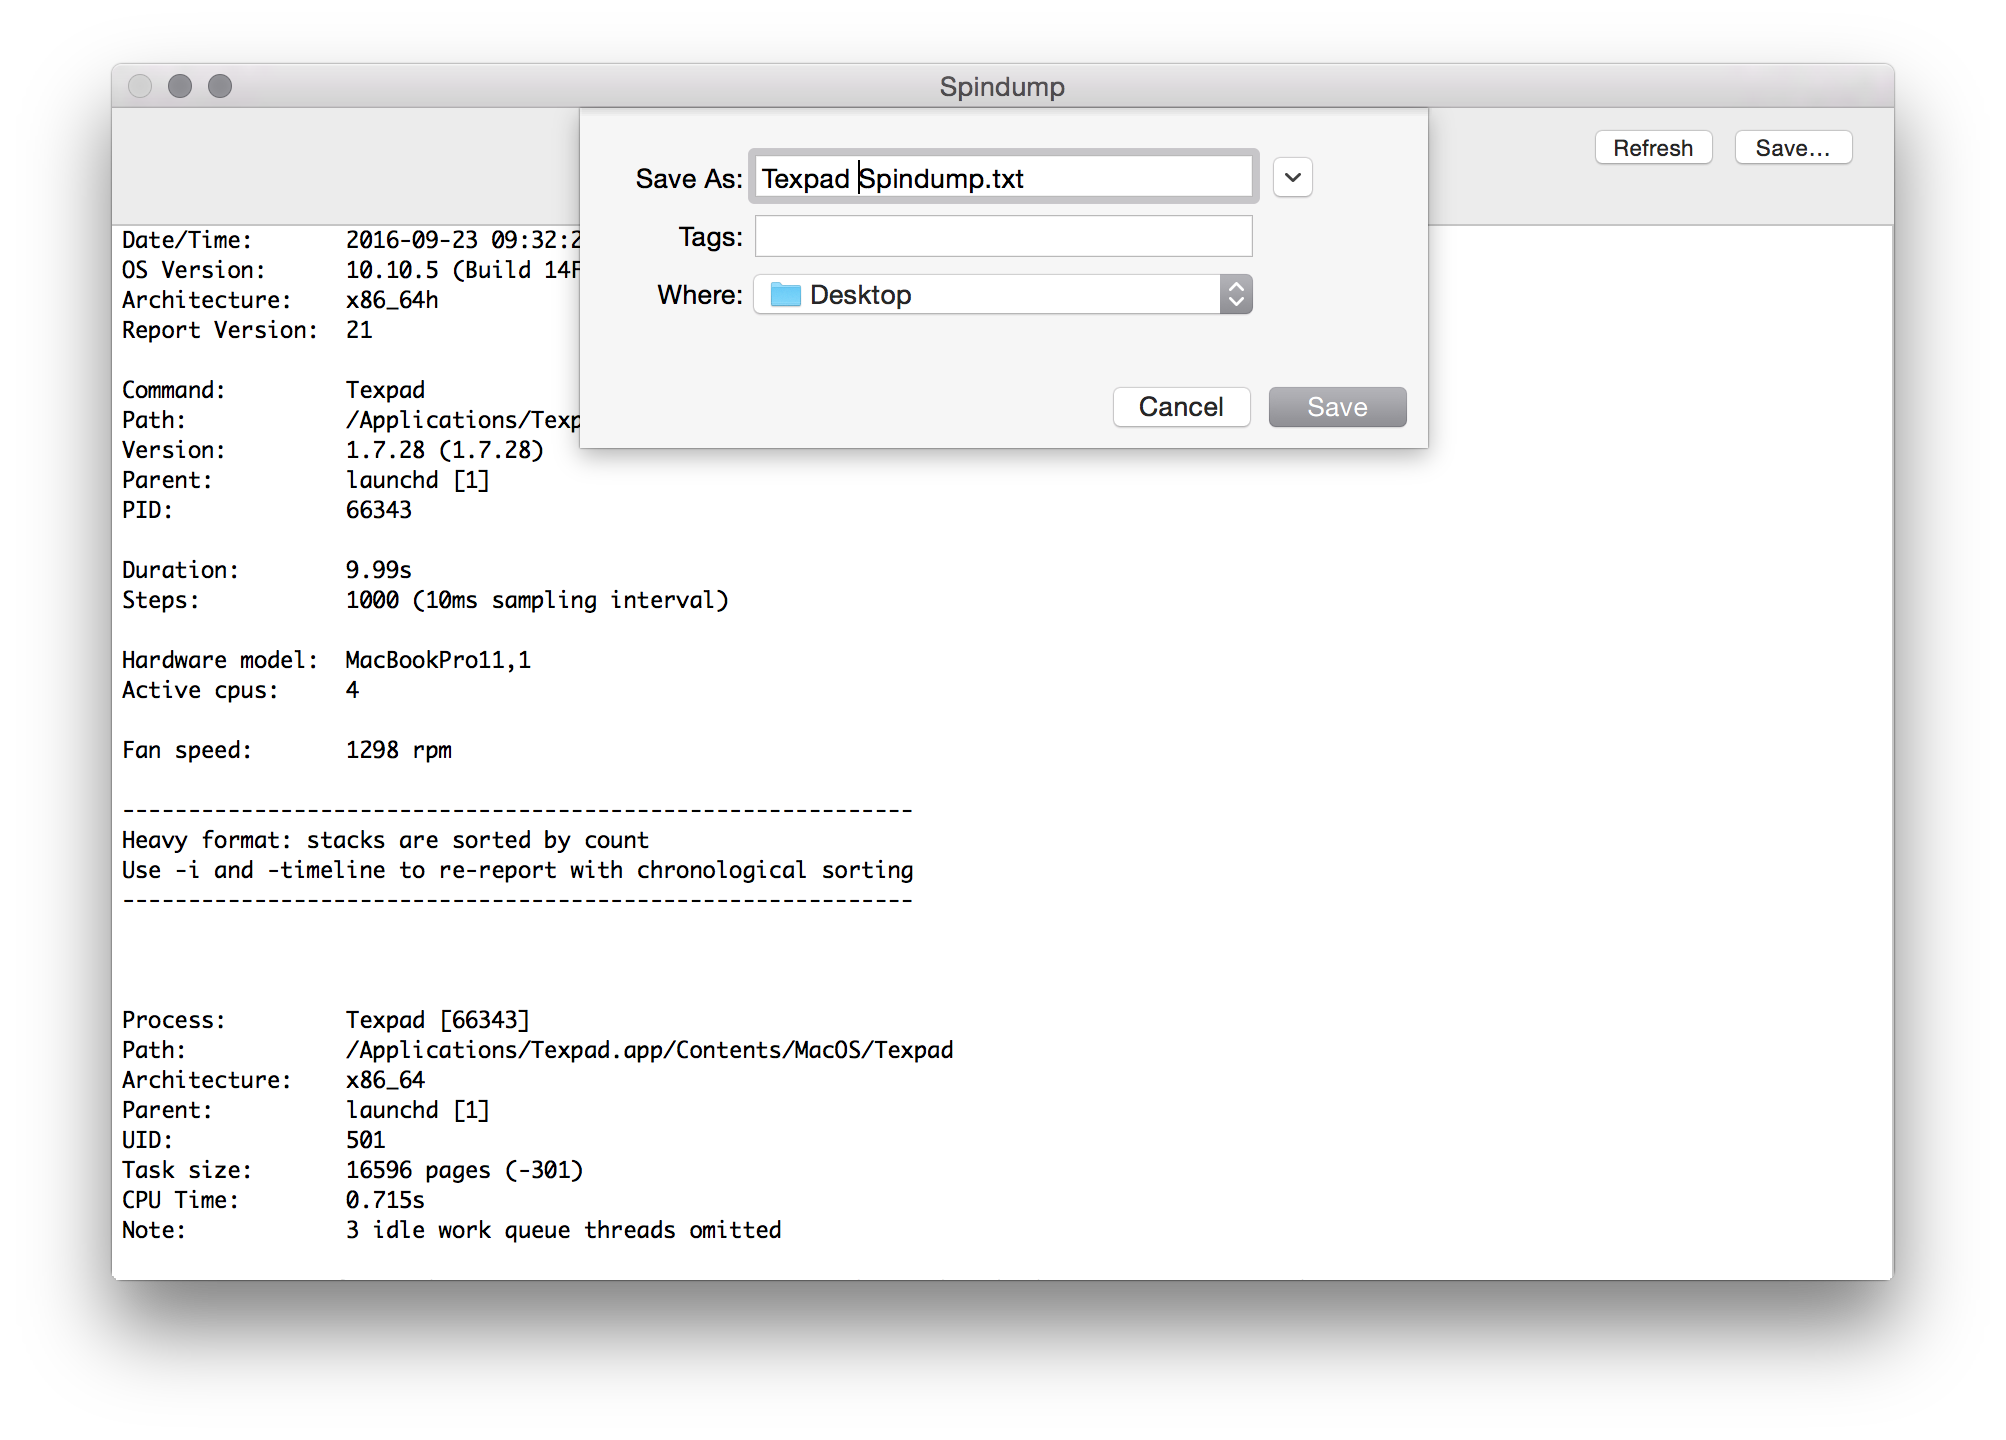
and email it to us.
Please note that it is very important that you are using Texifier during the period of the Spindump. If you are not actively using Texifier with it and demonstrating the lag, then the Spindump will just show Texifier waiting for input rather than showing us what it is doing whilst you are experiencing a lag.